
The Stock Market’s long-term trajectory is based on growth, or lack thereof. That growth is valued based on Earnings of the companies which comprise the S&P 500 or Dow Jones or Nasdaq Composite. Think of these earnings much like an engine of a car. A healthy engine can last quite a while, but the longer it continues working hard, the more in need of maintenance it becomes. When we get our vehicles serviced and our radiator is cracked or our battery dies, we don’t chop the whole car up and call it totaled or broken. That would be foolish, we instead service and fix the problem area and continue to run our vehicle forward.
The stock market as stated above has a longer-term trajectory based on fundamentals. Counter, on the shorter-run markets can trade based on sentiment, psychology and human emotions. Much like we emotionally want to blow a gasket (no pun intended) when our radiator actually cracks. And as much as we want to throw our car away….well it isn’t the best decision. Just like market corrections. Throwing away our investments or bullish thesis longer term is not the best decision.
The key is to distinguish those potential “sentiment or emotional” driven times, vs real fundamental changing times. The S&P 500 hit a high this week of 2491. We had laid out a 2500-2550 target for 2017. As we enter our target range we update our dynamic analysis on the fundamental and technical front. Earnings so far continue to come in strong on the aggregate and support a fairly valued market up at these levels. This means the market is not truly cheap, but it is not outright expensive either. So under the surface the market is still very fundamentally strong, but it is now trading at levels which we expected and the risk to reward balance is no longer as favorable. Growth abroad is also continuing to surprise to the upside. With Earnings Season coming to an end, the Market will focus more on political and geopolitical issues which will be bumpy.
Technically the Market hit strong resistance levels and clusters as the internal structure has been weakening. Technically, the Market is now entering the area where a swift, strong corrective pull-back makes more and more sense. We have very strong support on the S&P 500 at 2325-2275. The upper end of that range would be about a 7% pull-back. The lower end closer to 9%.
Our expectation is that a “sentiment or emotion” driven correction is what is in order, not a fundamental or earnings driven down turn. Bear Markets happen based on fundamentals, not “emotional corrections”.
We thought this would be a worthwhile exercise. The chart below has highlighted the last 5 greater than 5% corrections.
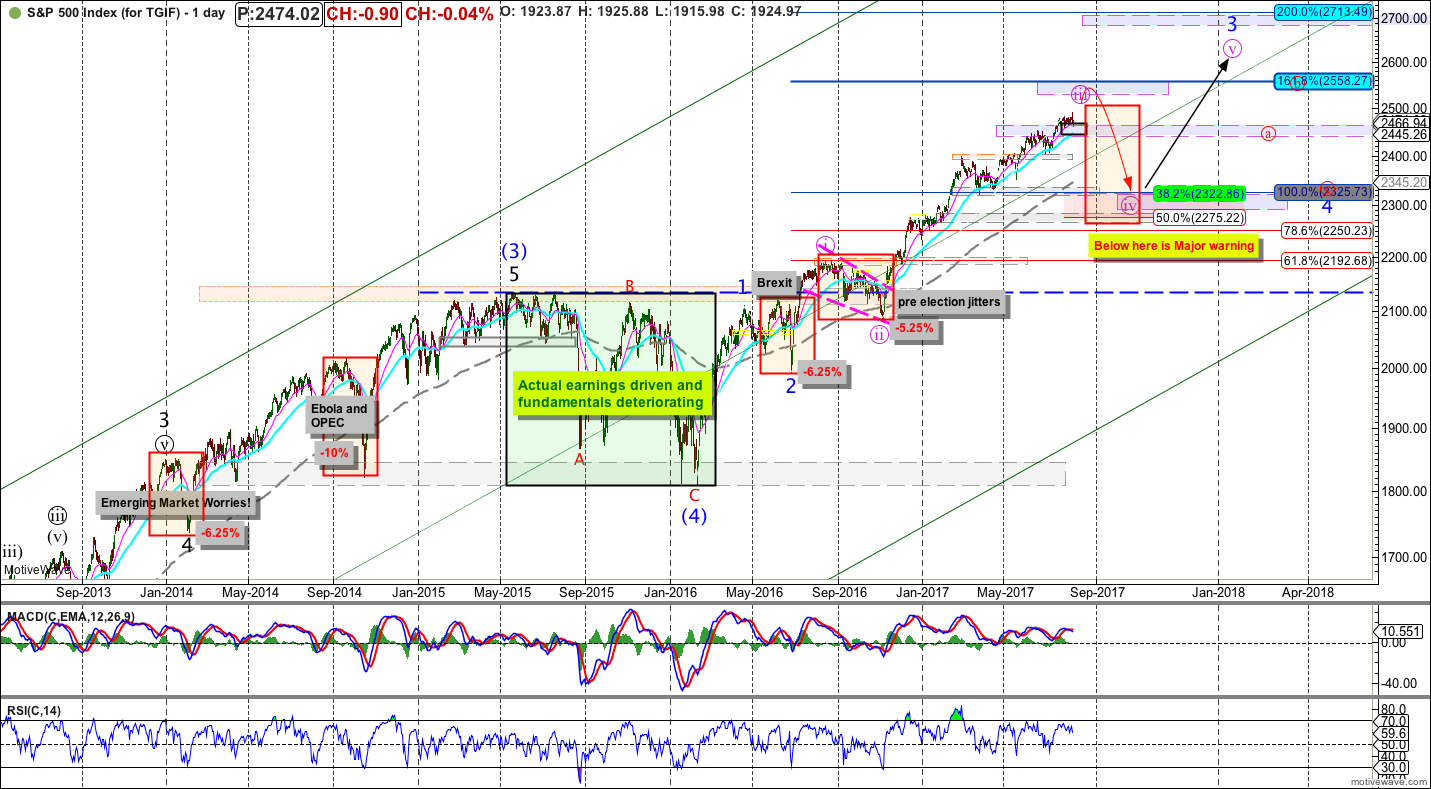
Highlighted Market Events:
- January of 2014 (lasted 1 month): based on Emerging market worries and a China banking shadow scare. The S&P 500 dropped 6.25%. It was fast, it was violent, it shook many people out of the market.
- October of 2014 (lasted 1 month): based on the big Ebola scare and OPEC no longer supporting oil prices. The S&P 500 dropped 10%. It was fast, it was violent, it shook many people out of the market.
- June of 2016 (lasted 1 month): based on the Brexit vote or the UK formally voting to leave the EU. The S&P 500 dropped 6.25%. It was fast, it was violent, it shook many people out of the market.
- September 2016 (lasted 2 months): based on the presidential pre-election jitters. The S&P 500 dropped 5.25%. It was fast, it was violent, it shook many people out of the market.
- The BIG prolonged green highlighted period July 2015 to February 2016 or 7 months was a larger 15% correction and was based on an actual earnings slow-down and fundamental deterioration in the economy.
Hopefully you are starting to see the difference.
As our analysis suggests we have entered a window in which a correction is more likely. We will not be surprised to see a strong event which stokes fear in the market and provides the necessary “emotional sentiment” to create a fast, violent, market downturn, which will shake many people out of the market.
It came as no surprise to us that North Korea seems to be the news driven reason for a potential correction. Maybe something else news driven will come out, we shall see.
Worried about the state of the world? Read our previous TGIF on this subject.
BUT, with a strong fundamental underpinning and higher technical targets yet to be hit for this Market, it gives us confidence to believe this potentially swift correction will be a buying opportunity. Therefore, we are positioned with increased cash and hedges to take advantage of an adverse market move.
For fun, here was the CNN Money Headlines on October 15, 2014, the EXACT day in which the LOWS of the 10% correction where hit:
“The Ebola epidemic is starting to contaminate sentiment on Wall Street, which is already losing sleep over countless crises”
“The arrival of Ebola in the U.S. has coincided with a period of extreme turbulence in the stock market, which has tumbled about 8% from record highs. The deadly virus is clearly not the only factor behind the market slide, but it’s a major unknown that is increasingly weighing on market psychology. That was the case again on Wednesday as the Dow plummeted as much as 370 points and health officials revealed a second health-care worker in Dallas tested positive for Ebola.”
The S&P quickly recovered to new highs by November and was much higher by December. We will surely see plenty of articles like this published.
Have a great weekend!
Mike Harris